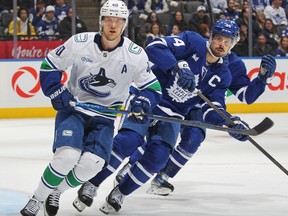
Elias Pettersson’s defensive performance on Saturday night was a massive difference maker in the Canucks shutting out the Maple Leafs. Read more.

They are not wrong.
And of course it was his line that scored the game’s first goal.
Talk about winning literally because of one guy’s efforts.
Even as Pettersson has struggled to produce points this season, those stretches have been too long for a front line player to be clear, his defensive game has never wavered.
As he once told me, he doesn’t like not having the puck. That’s why he works so hard on defence: to get the puck back.
Now just convert that back into scoring and the Canucks will be playing like the team they believe they can be.

Shooting blanks
The remarkable thing about Pettersson’s season is pretty simple: the Canucks are shooting blanks with him on the ice this season.
Pretty much all his numbers are similar to past seasons, though maybe a touch behind: the Canucks are getting roughly the same percentage of shots and scoring chances when he’s on the ice.
But they’re not finishing like they have in the past with him on the ice.
Last season the Canucks scored on 13.4 per cent of the shots taken with him on the ice. The season before that was 12.1. Generally these have been pretty consistent numbers.
It speaks to the quality of chances that Pettersson helps his team create.
This season, though, the Canucks are scoring on just 9.5 per cent of the shots taken with him on the ice.
And we can see where the shots are being taken while he’s on the ice this season vs. last season:

The Canucks are struggling to generate shots from on top of the crease this season. This has been a general problem this season for the whole team.

Last season, Pettersson and his mates had no trouble getting to the net.
This is the thing the Canucks need to fix to get back to the team they want to be.
On the other hand…
Know who is generating good chances still?

Indeed, by Natural Stat Trick’s expected-goals measure, this is Miller’s best expected-goals share season as a Canuck.
The Canucks are getting 54.7 per of the total expected goals generated while he’s on the ice. Before this season he’s generally been a 50/50 player.